Reverse Engineering is a hot topic in the field of CAD/CAM technology in recent years. Simply put. If the traditional process of designing a product is called forward engineering. Then, the product model (or physical) - CAD information model - CAM or rapid prototyping process is called reverse engineering. In a general CAD system, the reconstruction of the solid model is completed automatically or partially interactively, and the CAD model of the complete data information is obtained. On the basis of this, the mold cavity is generated by appropriate conversion method, and the cavity is completed by image programming technology. The CNC machining process is planned and the corresponding NC commands are generated. At the same time, the STL file for rapid prototyping can be output to quickly produce the prototype.
Second, the processing of measurement results and model reconstruction
1. Coordinate measurement and data extraction
There are many measuring methods used in reverse engineering, such as light cutting, chromatography, industrial CT, CMM (coordinate measuring method). Because coordinate measuring method is convenient to use and has high precision, it is suitable for enterprise use. Therefore, this scheme uses the coordinate precision measurement method. How to measure data is the first problem to be considered. The data points that can express the physical features are the basis of modeling. Therefore, the measurement must be considered in combination with the modeling. In order to make the measured data points to meet the modeling needs to the utmost, it is necessary to choose the appropriate modeling method. When the product shape is simpler. When the normal direction of the outer surface is within 180 degrees, the UG/FREE FORM FEATURE/ FROM POINTS and /FROM POLES modules can be used; for a tubular object having an irregular surface such as an exhaust pipe of an automobile engine, in the case of three-coordinate measurement, It is difficult to specify a position measurement on it to generate a section line in the future. It is easier to measure according to the cross-section. Therefore, when measuring with three coordinates, measure some complete cross-section data as much as possible. If the complete cross-section data cannot be measured, measure as many points as possible for later use.
Measuring machine inspection—The complete process of a point includes the following aspects:
(1) Select the type and specification of the measuring tool and determine the mounting state of the workpiece: the measuring head is used as a measuring tool (corresponding to the tool during machining), and is installed in the vertical moving part of the machine tool. In the contact measurement, the measuring machine The efficiency and accuracy are closely related to the measuring head. From the structural principle, the measuring head can be divided into three types: mechanical, electric and optical. Optical non-contact measuring heads apply the principles of optics and lasers. Mainly used in precision coordinate measuring machines in the measuring room. The contact type measuring head can be further divided into two types: a hard probe and a soft probe. Hard probes are mostly mechanical probes and are mainly used for passive measurement. The soft probe is equipped with an electric sensor. The probe can be used for displacement and deflection, so it can be used in automatic measurement. Determining the mounting state of the workpiece means that the workpiece is easily mounted for measurement.
(2) The probe moves quickly to the positioning point and is positioned with a certain precision.
(3) The probe approaches from the positioning point to the measured point of the workpiece at a slow speed. When the contact state reaches the requirement, a zero-crossing signal is sent, and the measurement is detected. The reading head is taken out on the three axes of X, Y and Z respectively. Measurement data.
(4) The data is sent to a computer for processing, and the measurement result is output.
Measurement methods—The two-dimensional continuous contour scanning method, which is generally a bit measurement method and continuous contour scanning method, is further divided into a contour continuous scan or a general continuous scan. Each of these methods has its own characteristics and applications.
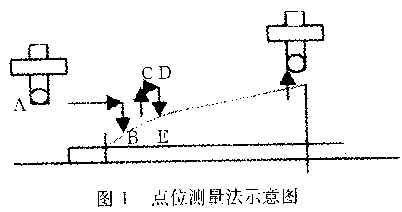
(1) Point measurement method This is a point-to-point measurement method, as shown in Fig. 1. The probe approaches the measurement point B from point A. After the measurement, the probe returns to point C, and then goes to point D according to the specified step, repeats the measurement of the next point E, and so on. Point measurement is used for the measurement of holes, baselines, and surface contours. For complex surfaces, a section is usually fixed first, and it is moved one by one in an axial direction (such as the X axis) for measurement. Then, after moving a prescribed distance in the Y direction, the measurement is sequentially moved to the other section in the X-axis direction.
(2) The profiling continuous scanning method continuously moves the surface of the workpiece, and the measuring points are sampled and recorded at predetermined intervals. The entire scan and measurement work is done automatically.
(3) The universal continuous scanning method is also called the program-controlled continuous scanning method. When this method is used, the movement track of the probe relative to the contour of the workpiece is given by a program stored in the computer.
2. Surface modeling and surface design
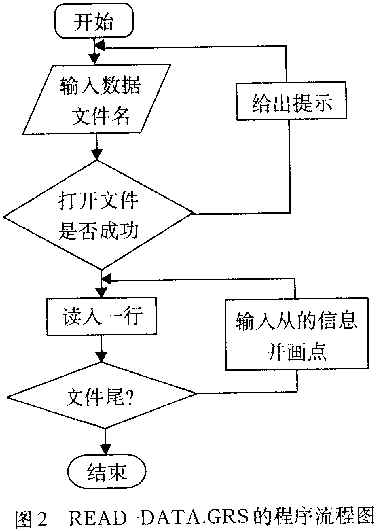
(1) Reading of data The output of the coordinate measuring machine may be a data file stored in a text file format of DOS. Each piece of data in the measurement has a data file corresponding to it. Since there are many data points and if you manually input them one by one, it is not only inefficient but also prone to errors. Therefore, we have written a program (read-dat.grs) in GRIP language, which is used to automatically read the data into UG and generate corresponding coordinate points. For the convenience of modeling, put different cross-section points on different layers. It is convenient for data selection during surface modeling. The flow chart of READ-DATA.GRS is shown in Figure 2:
(2) Point processing The point after reading is not suitable for direct modeling. This is because, on the one hand, although the measuring points in one section should theoretically be in one plane, due to the error of the measuring machine and others The influence of the factors, the coordinate values ​​of the obtained data points may have a small deviation; on the other hand, the point read is not the point on the surface of the measured part, but the coordinates of the coordinate measuring machine probe 41JLl. Using such points to directly shape, obviously can not meet the requirements. The resulting curve may not be smooth and not in the same plane, so that the final surface does not meet the requirements, or only the sheetbody can be created and the entity cannot be generated. Therefore, the points read in should be processed:
Project: First remove those points that have significant errors, and then project the points on each section into the corresponding plane (using UG/Curve/Project).
Eliminate the influence of the probe radius on the data: the data read by the coordinate measuring machine is the position coordinate of the center of the probe, not the position coordinate of the spherical surface of the probe and the contact point of the workpiece, and the difference between the difference and the radius R of the probe The size is related to the measurement position. In order to get the correct measurement results, the measurement results should be corrected. At present, there are two ways to solve this problem. One is to establish a free-form surface describing the trajectory of the measuring center of the probe, with its normal equidistant surface as the true expression of the measured surface; the second is to use the facet closely related to the measurement control strategy. Algorithm, compensation for the radius of the probe. The so-called facet compensation algorithm refers to taking the four points around the point in order to obtain the coordinate value of a point on the surface. The facet vector composed of these four points is used as the normal vector of the point to be measured. After calculation, the coordinate value of the point to be measured is obtained. In the calculation of this paper, the first method is adopted, that is, the normal equidistant surface of the trajectory of the measuring head is used as the measured surface.
There are two ways to achieve this. One is to directly use the measuring point to make the track surface of the probe center, and then use the offset surface function of UG to generate the normal offset surface; the other is to use the measuring point to generate the cross-section lines of the track surface of the probe core. The UG offset curve function is then used to generate the normal bias lines, and finally these section lines are used to generate the desired final model. We choose the latter method. Because if the surface of the spherical core is first generated and then the surface is offset, it is likely to be impossible when the surface is complex, and the amount of calculation of the offset surface is obviously much larger than the calculation of the offset curve. Moreover, after the offset surface is generated, if it needs to be modified, the spherical track surface can be modified first, and the system will recalculate to update the offset surface, which will inevitably cause time waste. The latter method can avoid the above disadvantages and is easy to modify.
3. Complex surface modeling
(1) The first step in the generation and processing of the section line is to generate the required section line. Since some data cannot be measured during measurement, there are two cases when re-generating the cross-section line: one is that the cross-section data is complete, and the other is that the cross-section data is incomplete. For the former, the UG/CURVE/SPLINE function can be used to create a closed B-spline curve; for the latter, the data must be supplemented first. Supplementing data points should facilitate the full use of the measured data. It will not affect the shape of the entity too much. Then you can complete the B-spline curve just like the former. Finally, the CURVATURE in UG/ANALYZE should be used to check the curvature of the section line, check the smoothness of the curve, and edit the undesired points with UG/EDIT/CURVE/SPLINE. The interactively edited curve is ready for use.
(2) Generation of free-form entities UG provides a variety of methods for generating surfaces. After comparative analysis, we chose UG/ FREE FORM FEATURE/THROUGH CURVES. The problem that should be noted during the modeling process is that when selecting the section line, the direction vector of each curve should be consistent, otherwise a distorted surface will be produced.
Use the following three methods to verify the quality of the generated surface:
Use the UG/SHADED IMAGE function to color the generated surface to observe the shape of the surface.
A plane is created at the position where the cross-section measurement data is obtained, thereby obtaining the actual section line at the place, comparing the measurement data with the actual data, and checking the error magnitude. It is also possible to take a section line at a position where there is no measurement data and check the smoothness of the curve.
The surface curvature check is performed by using the ANA software analysis check module ANALYZE.
Using the above three methods, if the quality of the surface is found to be unsatisfactory. The test curve can be used as one of the generated curves. Add to the original generation curve and re-edit the smoothing until a satisfactory surface is generated.
(3) The final generation of the model follows the above procedure to generate the remaining free-form entities needed. Combine the partial entities into a whole by Boolean operations. Before merging, it is necessary to cut off the unneeded parts of the body (using a Trim body or a multi-faceted split body). After the merger, plus some simple voxels, you can use it as the final model.
(4) Selection of various modeling methods and precautions The CAD modeling of the product has its own characteristics. The various parts vary widely, and it is impossible to have a modeling method suitable for all parts. This requires different methods depending on the characteristics of the shape. In a nutshell, the following methods can be used in UG:
1) For parts with simple structure, they are formed with voxels or scanning features.
2) Boolean operations can be performed with existing simple or complex entities, that is, intersections, differences, and differences between entities are generated to generate complex entities.
3) First create a curved surface of the desired shape, and then use the curved surface to cut the existing solid to obtain the solid with the desired shape surface.
4) If it is difficult to generate a complex curved body at one time, it is possible to separately generate several necessary complex curved surfaces, and simultaneously make necessary curved surfaces or planes, and then stitch these surfaces to form a solid.
Solid modeling of complex surfaces is much more complicated than regular entities. First of all, there are many modeling methods that can be used. How to choose the best results?
The following summarizes several rules:
Passing points and control points (THROUGH PIONTS and THROUGH POLES): These two methods provide the most direct control over the generated surfaces, which is their advantage. However, in actual modeling, there are often many data points used to generate the surface, which brings considerable difficulty to the selection of points. Let the surface pass the given value point. The system necessarily needs to calculate the control points of the surface, so in the case where the surface control points can be obtained, the control points are used to generate the surface as much as possible, which will achieve better precision and efficiency.
Through curves: The method of generating a surface by a curve is a commonly used method in free-form surface modeling. This method only requires the user to provide a section line, so it is suitable for those situations where it is difficult to obtain a guide line. For example, circular section parts, it is difficult to measure the data points used to generate the guide lines during the measurement, and the data of each section is easy to obtain, in this case. It is convenient to use the method of passing the curve.
The degree of the curve in the U direction is determined by the highest number of times in the section line. For a single patch, the highest number of times in the V direction is the number of selected section lines minus one. For multi-surface patches, you can specify a number of times in the V direction. The recommended default is 3. Because such surfaces are faster in later operations (such as machining, display, etc.). Moreover, the information conversion reliability in different CAD systems is high. High-order surfaces created at the same time through many points can also lead to unpredictable results.
Third, the conclusion
Precision measurement of the surface of complex profiled parts with the aid of a coordinate measuring machine. It is an effective way to improve the speed of product development by obtaining the value point and then transferring the result to the prototype reconstruction in the CAD system. On this basis, the NC instruction of rapid prototyping and NC machining is realized.
This catalogue include 110w,220w,450w,600w quantum board, use samsung LM301B+Epistar 660nm chip, meanwell driver, works well for indoor plant growth. Diy Quantum Board Grow Light the best choose for indoor plant growth, Whether it's hydroponics, plants in soil, you can add a touch of magic to every veg and flower with QB grow lights.

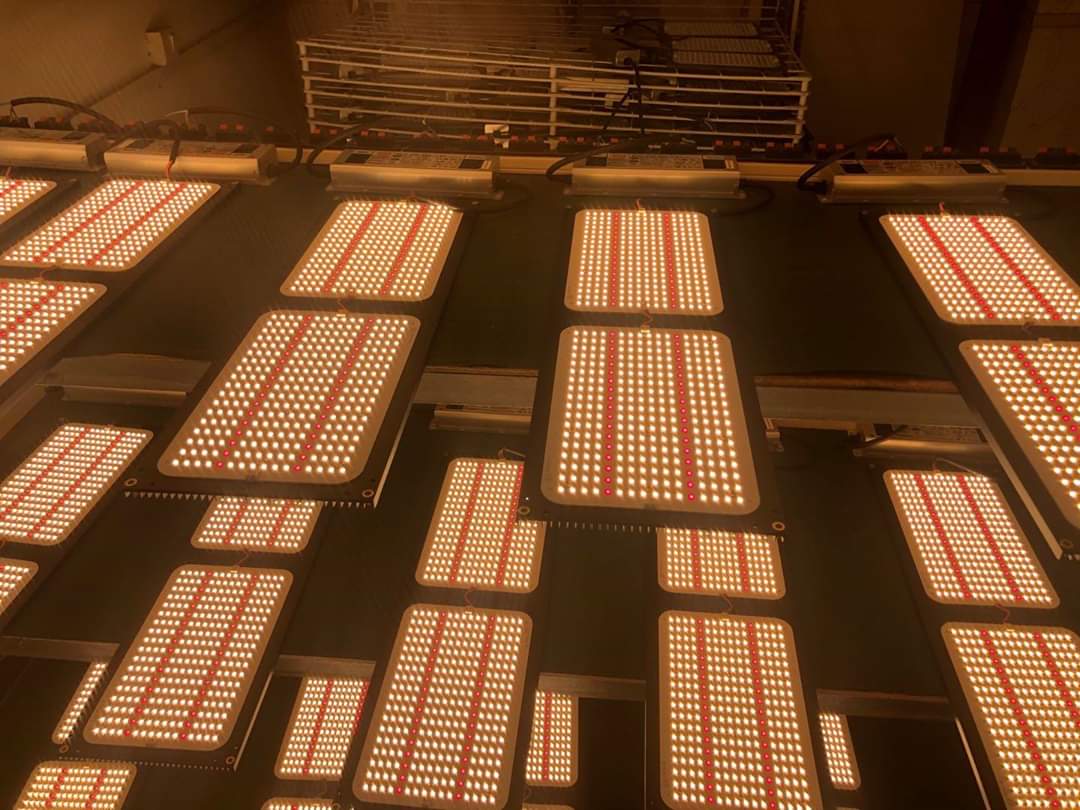
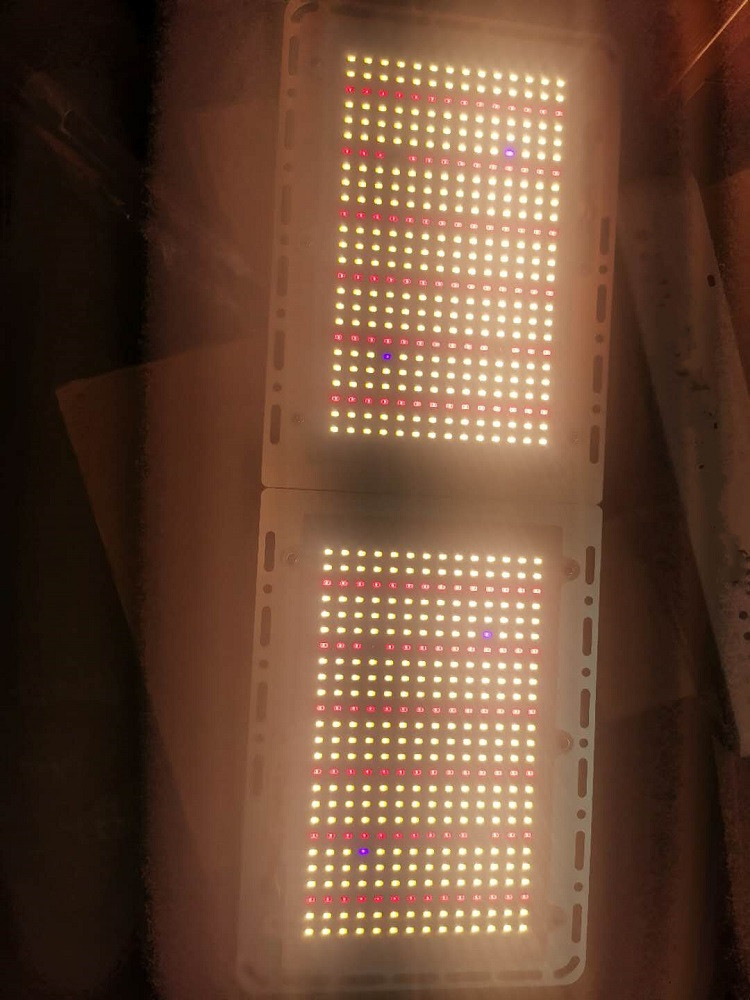
Quantum Board Samsung,Samsung Led Quantum Board,Samsung Quantum Board Led,Quantum Board Vs Cob Grow Light
Shenzhen Wenyi Lighting Technology Co., Ltd , https://www.wenyigrow.com